Directions (1-5): निम्नलिखित संख्या श्रृंखला में गलत पद ज्ञात कीजिए।
Q1. 8, 10, 20, 70, 320, 1570, 7830
(a) 7830
(b) 10
(c) 8
(d) 320
(e) 1570
Q2. 18, 20 , 43, 133, 537, 2691, 16163
(a) 43
(b) 16163
(c) 133
(d) 537
(e) 2691
Q3. 124, 140, 108, 156, 92, 172, 78
(a) 108
(b) 124
(c) 78
(d) 92
(e) 140
Q4. 260, 380, 510, 618, 759, 856, 1008
(a) 759
(b) 1008
(c) 260
(d) 510
(e) 618
Q5. 267, 343, 610, 953, 1563, 2515, 4079
(a) 4079
(b) 953
(c) 343
(d) 267
(e) 2515
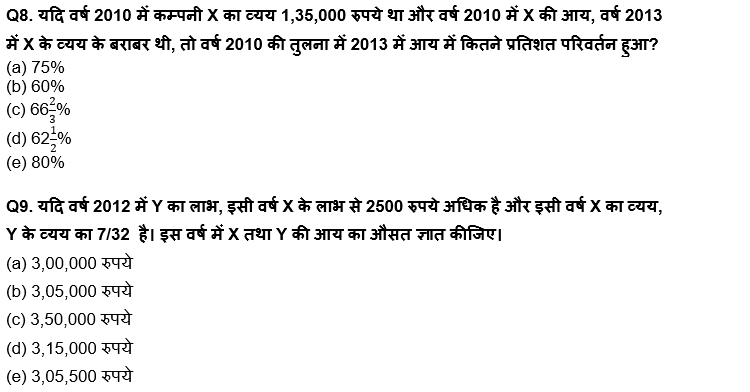
Directions (6-10): नीचे दी गई तालिका छह वर्षों के दौरान दो विभिन्न कम्पनियों X और Y के लाभ प्रतिशत को दर्शाती हैं।
(i) लाभ = आय – व्यय
(ii) लाभ % की गणना कुल आय के प्रतिशत के रूप में की गई है

Q6. वर्ष 2009 में कम्पनी X का लाभ 1,08,000 रुपये है और इसी वर्ष में कम्पनी Y का लाभ 1,75,000 रुपये है, तो वर्ष 2009 में कम्पनी Y के व्यय का, इसी वर्ष में कम्पनी X के व्यय से अनुपात कितना होगा?
(a) 45 : 68
(b) 18 : 35
(c) 24 : 49
(d) 35 : 54
(e) 35 : 58
Q7. यदि वर्ष 2011 में कम्पनी Y का व्यय, वर्ष 2010 में कम्पनी Y के व्यय से 36,000 रुपये अधिक है, तो कम्पनी Y के द्वारा इन दो वर्षों में अर्जित किये गए लाभ और कम्पनी X द्वारा वर्ष 2011 में अर्जित किये गये लाभ का औसत ज्ञात कीजिए। (इन दोनों वर्षों में X और Y की आय को समान माना जाए)।
(a) Rs. 1,32,000
(b) Rs. 1,34,500
(c) Rs. 1,20,000
(d) Rs. 1,40,000
(e) Rs. 1,36,000

Q10. वर्ष 2010 में X तथा Y का कुल व्यय, इसी वर्ष उनकी कुल आय का 45% है। तो, उस वर्ष उनके लाभ का अनुपात (X : Y) ज्ञात कीजिए।
(a) 4 : 5
(b) 5 : 6
(c) 5 : 7
(d) 3 : 4
(e) 2 : 3
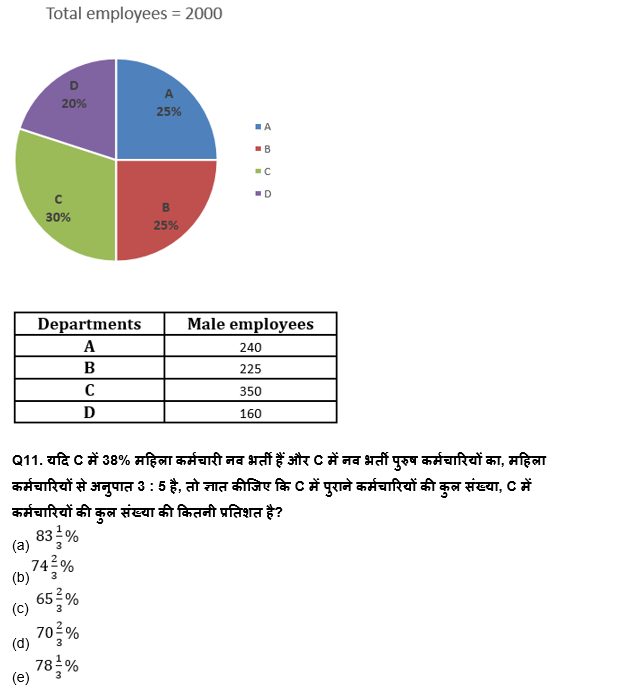
Directions (11-15): नीचे दिए गए पाई चार्ट और तालिका का अध्ययन करें और निम्नलिखित प्रश्नों के उत्तर दें।
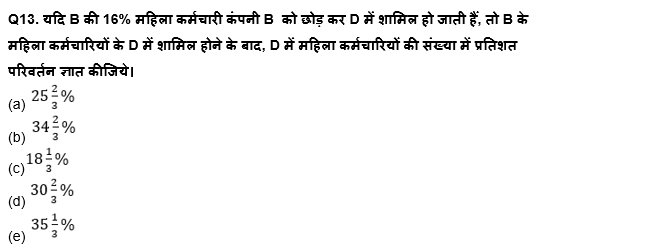
पाई चार्ट एक कंपनी X के 4 विभिन्न विभागों (A, B, C और D) के कुल कर्मचारियों के प्रतिशत वितरण को दर्शाता है और तालिका इन विभागों में पुरुष कर्मचारियों की संख्या को दर्शाती है।

Q12. यदि कंपनी Y में पुरुष कर्मचारियों का, महिला कर्मचारियों से अनुपात 4: 3 है और कंपनी Y के पुरुष कर्मचारी, कंपनी X के C में पुरुष कर्मचारियों की तुलना में 300% अधिक है, तो ज्ञात कीजिये कि कंपनी Y में कुल कर्मचारी, कंपनी X के कुल कर्मचारियों से कितने अधिक या कम हैं?
(a) 450
(b) 800
(c) 560
(d) 630
(e) 750

Q14. यदि कंपनी K में पुरुष कर्मचारी, कंपनी X में B में महिला कर्मचारियों की तुलना में 425 अधिक है, तो ज्ञात कीजिये कि कंपनी X में A, C और D में महिला कर्मचारियों की औसत संख्या, कंपनी K में पुरुष कर्मचारियों की संख्या की तुलना में कितनी कम है?
(a) 400
(b) 450
(c) 360
(d) 480
(e) 520
Q15. यदि कंपनी X में A, B, C और D में (18-40) आयु समूह के कर्मचारियों का, (40+) आयु समूह के कर्मचारियों से अनुपात क्रमशः 13 : 12, 13 : 37, 4 : 1 और 33 : 7 है, तो कंपनी X में (18 – 40) आयु समूह के कर्मचारियों की कुल संख्या का, (40+) आयु समूह के कर्मचारियों की कुल संख्या से अनुपात ज्ञात कीजिये।
(a) 2 : 1
(b) 9 : 5
(c) 5 : 4
(d) 3 : 2
(e) उपरोक्त में से कोई नहीं
Solutions:


(b) 16163
(c) 133
(d) 537
(e) 2691
Q3. 124, 140, 108, 156, 92, 172, 78
(a) 108
(b) 124
(c) 78
(d) 92
(e) 140
Q4. 260, 380, 510, 618, 759, 856, 1008
(a) 759
(b) 1008
(c) 260
(d) 510
(e) 618
Q5. 267, 343, 610, 953, 1563, 2515, 4079
(a) 4079
(b) 953
(c) 343
(d) 267
(e) 2515
Directions (6-10): The given table shows the profit percentage for two different companies X and Y over a period of six years.
(i) Profit = Income – Expenditure
(ii) Profit % is calculated as percentage of total income

Q6. If the profit of Company X in year 2009 is Rs. 1,08,000 and that for Company Y in that year is Rs. 1,75,000 then find the ratio of expenditure of Y in 2009 to that of X in that year.
(a) 45 : 68
(b) 18 : 35
(c) 24 : 49
(d) 35 : 54
(e) 35 : 58
Q7. If the expenditure of Company Y in 2011 is Rs. 36,000 more than that of Company Y in 2010 then find the average of profit made by Y in these two years and Company X in 2011. (Consider income for X and Y is same in these two years).
(a) Rs. 1,32,000
(b) Rs. 1,34,500
(c) Rs. 1,20,000
(d) Rs. 1,40,000
(e) Rs. 1,36,000

Q10. In year 2010, total expenditure of X & Y is 45% of their total incomes in that year. Then, find the ratio (X : Y) of their profits in that year?
(a) 4 : 5
(b) 5 : 6
(c) 5 : 7
(d) 3 : 4
(e) 2 : 3
Directions (11-15): Study the pie chart and table given below and answer the following questions.
Pie chart shows the percentage distribution of total employees of a company – X in 4 different departments (A, B, C & D) and table shows the number of male employees in these departments.


Q12. If ratio of male employees to female employees in company – Y is 4 : 3 and male employees in company – Y are 300% more than male employees in C of company – X, then find total employees in company – Y are how much more or less than that of in company – X?
(a) 450
(b) 800
(c) 560
(d) 630
(e) 750

Q14. If male employees in company – K are 425 more than female employees in B in company – X, then find average number of female employees in A, C & D in company – X are how much less than male employees in company – K?
(a) 400
(b) 450
(c) 360
(d) 480
(e) 520
Q15. If ratio of employees who are in (18-40) age group to employees who are in (40+) age group in A, B, C & D in company – X is 13 : 12, 13 : 37, 4 : 1 & 33 : 7 respectively, then find ratio of total no. of employees of (18 – 40) age group to total no. of employees of (40+) age group employees in company – X.
(a) 2 : 1
(b) 9 : 5
(c) 5 : 4
(d) 3 : 2
(e) None of the above.
Solution


 LIC ADO Mains क्वांट क्विज 2023 - 17th ...
 LIC ADO Mains क्वांट क्विज 2023 - 16th A...
 LIC ADO Mains क्वांट क्विज 2023 - 12th A...


